Purpose of Research

Year on year, there are various discussions around common topics and one of these, which is very popular in the Facebook Support Group, is around how the scoring works in AQE and what percentage mark would be need to be achieved for a child to score a standardised score of 100 or above. In addition, there is always a significant curiosity around the impact of age on a child’s score.
Whilst, AQE had offered an insight into their scoring process (see here for more info – AQE Scoring Explained), it still left a number of unanswered questions and this research was an attempt to break down some of those common, scoring questions and start to get a clearer understanding of the correlation between the raw scores and the standardised ones.
Limitations With The Data Submitted

Before I start to delve into the whys and wherefores of what the data told us, it’s important to understand that the biggest challenge we had in analysing the data was the lack of a full and complete set of information. In total, there were 149 useable data submissions (which people had sent me through the Support Group) and whilst that may seem like a lot, when we put this into the context that 7,725 children sat the AQE test in 2016, you can understand that this is a very small percentage, about 2% of total applications.
In addition to the sample being small, it is understandable to appreciate that the parents who ‘played along’ were the ones that were happy with their child’s result, whilst others were maybe quicker to put the whole experience behind them. This was reflected in the fact that the average standardised score of the whole sample was 107 and only twenty-four submissions had a standardised score of less than 100.
Inevitably, a smaller data set and a skewed one (to the right), will ultimately impact on any statistical analysis – however, we’ll press on with those limitations clearly set out.
Variables And Assumptions

The final piece of housekeeping I have do, it point out the variables in any raw scores submission, along with the assumptions we made during the analysis.
For each child, their main variable would be the cohort they are placed into (which is essentially based on their age in days) and this has the added complexity that a child’s cohort may change as they become older and move into a different group – which, in my opinion, is an overly-engineered element to the process and quite unnecessary – alas, it is what it is.
In addition, the assumption made is that the highest raw scores were the ones used to contribute to the corresponding, resulting standardised score – however, this may not hold true if the average raw score of one paper was significantly lower than that of another, even if the child achieved a lower percentage raw score. If we had a complete set of data, we could have worked out the average of each paper, but working within the limitations of our sample, assumptions had to be made to progress.
Little Difference Despite 10-11 Months Younger

A common myth is that people believe a younger child will get extra marks, simply for being younger, but categorically, as outlined by the AQE process, this is not the case. However, it was also an hypothesis we wanted to explore with our data sample and we found that there was evidentially no linear relationship relating to higher standardised scores for younger candidates with similar raw scores. That’s not to say that the age of a child, or rather, the cohort they find themselves in, could not have had some impact on their standardised score, but one cannot simply say that a younger child will benefit when it comes to their age. For example, hypothetically a child in a December cohort may benefit from a lower average of that group, not because of age, just because of the performance of the group.
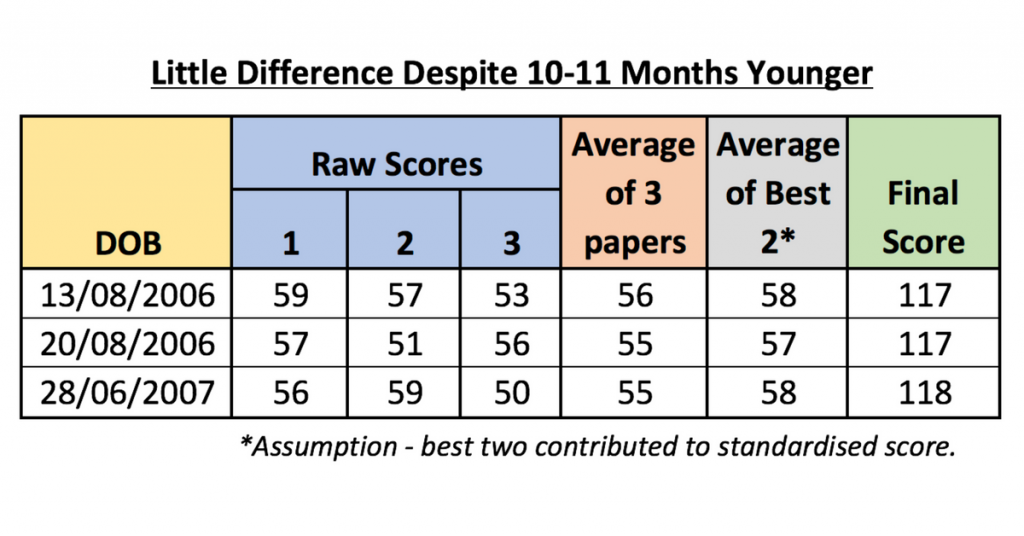
To provide some statistical evidence to support this, the data above shows three children, two of which are born in August and one born in June the following year – so effectively 10-11 months younger. In this particular set, the all scored around the 55 mark when an average was taken of all three papers, but when you look at the average of the best two, you can see that the 28th June child did slightly better than the 20th August child. The result was that the August children received 117 standardised score and the June child was awarded 118 – more likely because of their performance on the day, and their standardised score in the test, rather than any age differential.
If there had been a statistical significance due to age, the 28/6 score would have been a lot higher or the older ones a lot lower.
This fact should offer some assurances to parents of children who are older and may have previously been concerned about being disadvantaged. This fact may also upset some parents of a young child who was maybe hoping for a few extra marks. Been on both sides of this myself. 🙂
Exploring The Impact Of Using ‘Best’ Papers
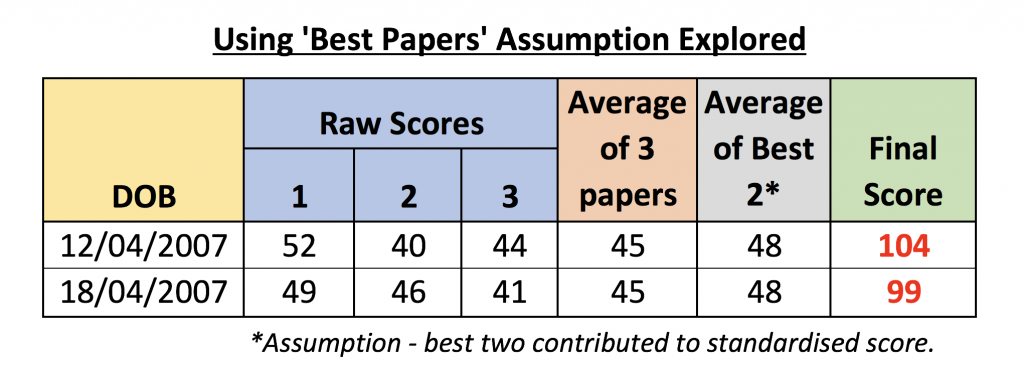
I know I’ve already touched on this assumption, but I want to drive home the importance of it and how unreliable it is. If you look at the data set above, you’ll see two children, in similar ages and the average of their three papers was identical (at 45), along with the average of their best two scores (at 48), however, the final score for each child was significantly different with one child obtaining 104 and the other one getting 99.
Based on this information, it is probably fair to assume that the 12/4 child, scoring 44 in Paper 3, ended up with a greater standardised score and this score helped to boost their final score of 104. In addition, the second part of their standardised score probably came from Paper 1 as again they did much better than the 18/4 child in this paper. However, it may also have been the case that the 18/4 child’s scores from Paper 1 and Paper 2 was used to calculate their final score (if this has been their highest standardised scores) – at this point we don’t know.
If you’re now completely confused, that’s completely understandable and such is the nature of statistics and working with limited sample data, however, the point is, you cannot simply look at a table of many raw scores and make judgements based on what you think your child would need, or make inference about age playing the key role. I hope that makes sense. 🙂
What Percentage Do You Need To Get 100?
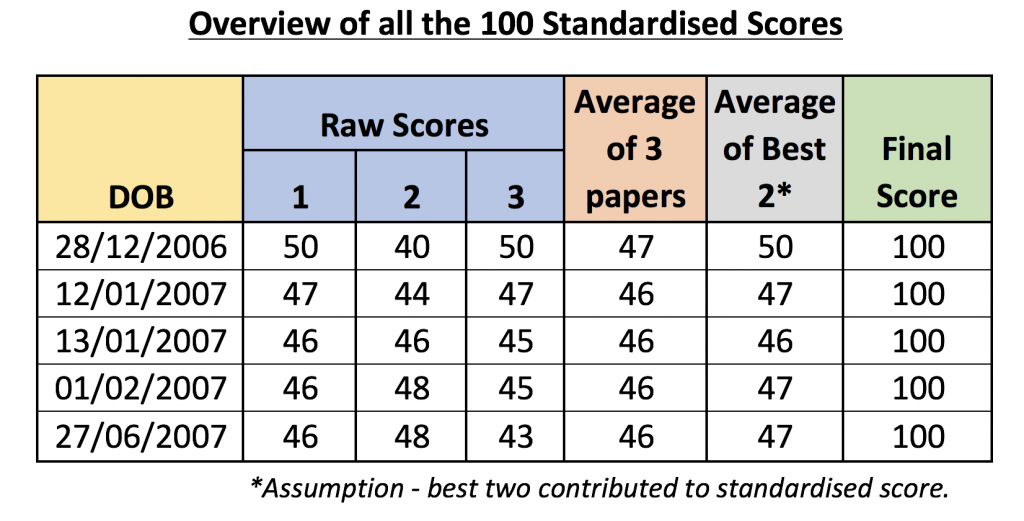
There were five submissions of raw marks that resulted in the final score of 100 and reviewing these we can see that there is a quite a tight group that achieved 46-47 on their best two scores, which, if we assume that these were the scores that contributed to their final score, then, we can say that, in this year, in these cohorts, if you obtained between 72% – 73%, you would have received a score of 100.
The top entry seems a little adrift as their overall average was higher compared to the other children who achieved 100, as was their average of the best two, but I reiterate, without knowing the average of each cohort for each paper, then it’s impossible to know if the two apparent ‘best’ scores were even used and what the resulting standardised score was for each paper. However, for this child, on the surface, it would appear that they scored 78% in their best two and achieved 100.
Therefore, what we can say for sure is that a score between 72% – 78% in 2017, achieved a final score of 100.
Taking a wider view of the overall data available, it’s fair to say that lower raw scores achieved higher standardised scores in 2017. Therefore, if your is doing a paper from last year and your child’s score takes a dive downwards, don’t panic, as this did seem to be more difficult papers that results in lower averages.
Paper 3 Average Lower in 2017

With the wider picture that we have behind the scenes, it shows that Paper 3’s raw scores to be less across the board – and therefore would’ve had lower averages.
This was interesting as I often witness many kids thinking, “That’s me, I’ve done two papers and that’s enough so I don’t need to try so hard for the third” and even parents losing some momentum on the third paper, with a sense that they’ve reached the end and are a bit burnt out. That’s not a judgement but merely an observation and with this information in your toolkit, it’s worth inspiring and injecting that extra special energy into Paper 3 because if a child scores 70% in all papers, if the average is lower in this paper and this have maintained a high performance in Paper 3 (and not dropped off), then they will yield a higher standardised score.
In saying that, Paper 3 may simply have been much tougher this year – but from the feedback in the group, this was not the general sense of feeling when the children came out of the test.
Using Test Papers To Gauge The AQE Score Your Child Will Achieve

Ultimately, it’s important to embrace the fact you cannot tell from a test paper how your child will do in the final AQE test as this will be based on the average of the cohort – so trying to do this, in my experience just causes stress and anxiety and not worth the effort. Take each revision time or practice paper as a learning aid for continuous development and no more.
It’s like comparing apples to oranges, it’s not possible. Each test will be different. Each child will feel different on different days with different energy levels and excitement, so all you can do is support the learning as best as possible and not become too focused on their score each time.
No Gender Significance

Contrary to some people’s views, there are no extra marks awarded to boys due to late development, so just worth being clear on this this point.
A Big Thank You To All Involved

A huge thank you to each individual who took the time to request their marks and complete the submission form, as without each of you doing this, this initial research would not have been possible.
Also, this wasn’t work that I undertook myself but was very much part of a team of three people and for this I’m very grateful as it has helped me immensely in the time (and experience needed) taken to conduct the analysis and as a sounding board in exploring the assumptions, ideas, concepts and learning points for future candidates (or rather for their parents).
I do hope that this has helped you understand the complexity of this scoring system and the danger of raw marks simply made available for people to make their own assumptions, and hopefully we can build on this research for next year and I have some ideas on how to do things better.
In the meantime, good luck to everyone and keep up the good work over the summer and make sure you get a good break too.
More About The Transfer Tutor Online Quizzes

The Transfer Tutor is an online site dedicated to providing fun and interactive quizzes aligned to the AQE / GL specifications. All quizzes are broken down into manageable topics and can be done on any mobile device, tablet or computer, so is an great way for kids to prepare for the test.

The quizzes have been a great success with parents and kids and has already received impressive 5* Facebook Reviews, so definitely worth a look.

To give you a feel for the quizzes, start the free quiz by clicking on the button below. I hope you enjoy and to get access to over 30 quizzes in Maths and English click here for membership options.